Centerity IT Performance Analytics Platform (Use Case #3 – Reducing MTTR)

Best Practices in Performance Monitoring for Big Data Environments (SAP HANA, Hadoop, Enterprise Applications)

Use Case #3 – Reducing Mean-Time-to-Restore (MTTR)

Synopsis:

  • Dynamic Threshold Alerting
  • Automated Remediation Actions
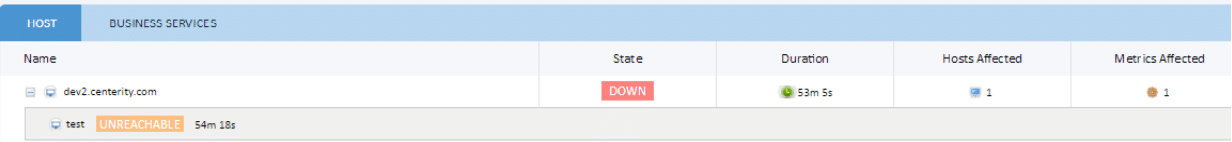
  • Outage Graphics

Use Case Overview

The number one driver of Customer Satisfaction and increasing Net Promoter Scores is reduced downtime. To do this, IT departments must avoid downtime and restore service quickly.

First, what is needed are smart static and dynamic thresholds that can provide proactive and automated actions before warnings become critical. While some circumstances can be anticipated with static thresholds, dynamic thresholds need to be “learned” by observing what is normal for a given hour of the day or day of the week.

Second, once topology and dependency maps are established, outages can be resolved quickly as alerts and graphical diagrams can pinpoint higher order problems that are causing a cascade of events. Resolving the higher order problem first is likely to resolve the lower order ones in the most expedient way.

Third, being able to see an entire business service view on a single console and show all the service levels from individual metrics to technology layers will highlight which component is causing a degradation of service and why. Seeing everything from a single console provides the entire organization with a single view of the truth upon which efficient and coordinated actions can be taken.

Technical Overview

Product Screen 8: Graphical Outage Screen

Outage Graphic

Full-Stack Performance Analytics for Pure

Delivering Holistic Visibility and Business Service Management (BSM) to FlashArray, FlashBlade, and FlashStack.

FlashStack

Overview

The Pure Storage FlashArray family delivers software-defined all-flash power and reliability for every need and every budget, from the entry-level FlashArray/M10 to the new FlashArray//X – the first mainstream 100% NVMe, enterprise-class all-flash array. The FlashArray model enables organizations to consolidate and accelerate workloads while enjoying proven 99.9999% availability, completely non-disruptive operations, and support that’s above and beyond.

Pure’s FlashStack Converged Infrastructure (CI) is a flexible, all-flash converged infrastructure solution that brings the flash revolution to your data center, faster. It combines the latest in compute, network, storage hardware and virtualization software, into a single, integrated architecture that speeds time to deployment, lowers overall IT costs, and reduces deployment risk. FlashStack CI provides the performance and reliability business-critical applications demand.

Centerity brings its industry-leading full-stack Performance Analytics and BSM Platform for Service Assurance to IT environments containing Pure FlashArrays, FlashBlades, or FlashStack products. Centerity’s unified software platform breaks down data silos by extending its performance and availability monitoring across the entire stack from the infrastructure layer to the application layer. By covering every technology layer, from the resident infrastructure to the critical applications, operating systems and databases running on it, Centerity can deliver service-centric business intelligence that enables Pure users to focus on the health of their business, not their infrastructure.

Looking For Service Pack Information? Download Here!

OR

Download The Full Solution Brief!

Full-Stack Performance Analytics for Pure


Centerity BSM & IT Performance Analytics Platform (Use Case #2 – Reducing Operational Complexity)

Best Practices in Performance Analytics  for Big Data Environments (SAP HANA, Hadoop, Enterprise Applications)

Use Case #2 – Reducing Operational Complexity

Synopsis:

  • Single Pane of Glass
  • Live Visual Layouts
  • Topology Mapping

Use Case Overview

Reducing operational complexity is key to the successful and efficient operation of any Big Data Environment. Having to jump from one console to another to gather performance metrics and manually correlate states for impact and trend analysis is not practical or efficient where automated, proactive intelligence is needed.

What is needed is a single-pane-of-glass across the entire Big Data Environment that can serve as a business intelligence layer across all the technical and functional domains. The business intelligence layer will normalize and organize performance metrics into technology layers and furthermore group these technologies into business process groups. These logical groups are called Business Service Management (BSM) process views.

Customized Live Visual Layouts can be created by importing any image (for example geographical maps, data center layouts, architectural schematics, technology stacks/racks) and overlaying status icons via Centerity’s GUI. All these icons are clickable and drillable. These live visual layouts represent how users want to view their environment and consume information. These layouts present intuitive ways of consuming information, not just because these are images, but because these are logical representations of the way individual users actually perform their functions.

Technical Overview

Product Screen 5: Central Dynamic Dashboard

Product Screen 6: Live Visual Layout (#1) – SAP HANA

Product Screen 7: Topology Mapping

Hypermap

About Centerity

Centerity’s an award winning unified enterprise-class IT Performance Analytics Platform that improves Performance and Reliability of business services to ensure availability of critical systems. By delivering a consolidated view across all layers of the technology stack, including, applications, big data, operating systems, database, storage, compute, security, networking, cloud, edge AND IoT/IIoT devices, Centerity provides an early warning of performance issues along with corrective action tools to quickly isolate faults and identify root causes.